
Guide
Best time to post on social media: test two windows on your own account
Find posting times for your audience using a practical experiment, comparable metrics, timezone checks, and a free tracker. Includes a worked data example.
Grow
Post and account insights come back from Meta within the hour, and benchmarks put your engagement next to the creators you track, so next week's posts can build on last week's results.
Sign up with Google or Microsoft, then choose your plan.
Post and account insights synced back within the hour
Benchmark your engagement against creators you choose
Results feed best-time scheduling and idea scoring
Krevaya Analytics
Followers, reach, and your top posts, with best times learned from your own results. Benchmarks put your account beside the creators you follow, and Krevaya Radar flags their breakouts. Meta insights sync back within the hour; Pinterest and YouTube numbers come from daily snapshots.
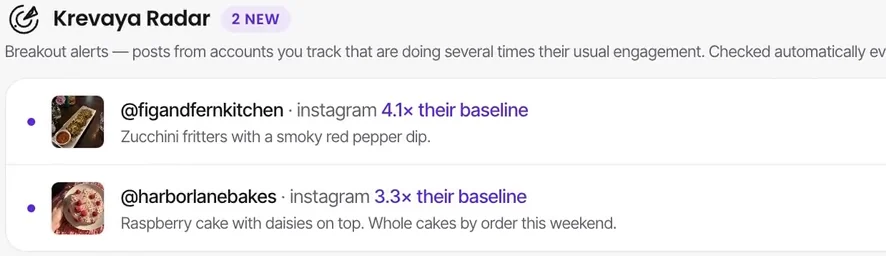
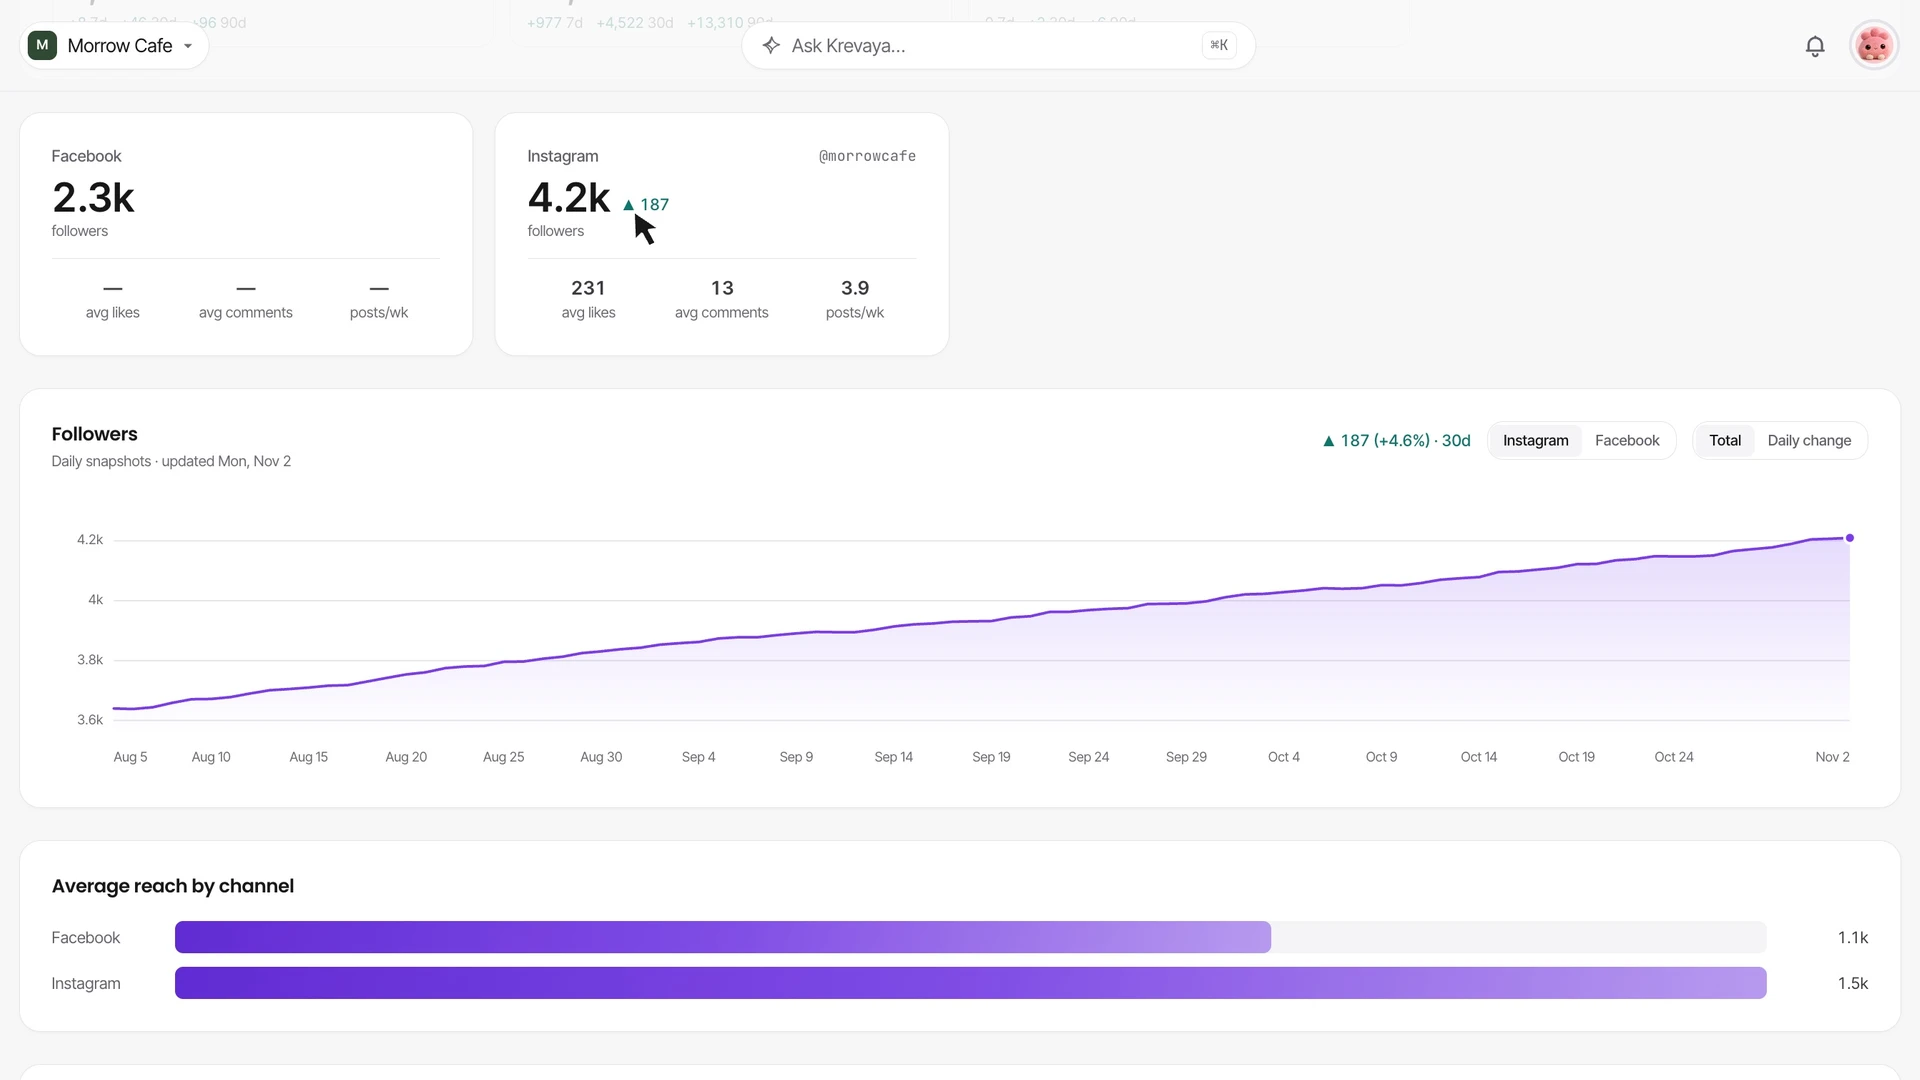
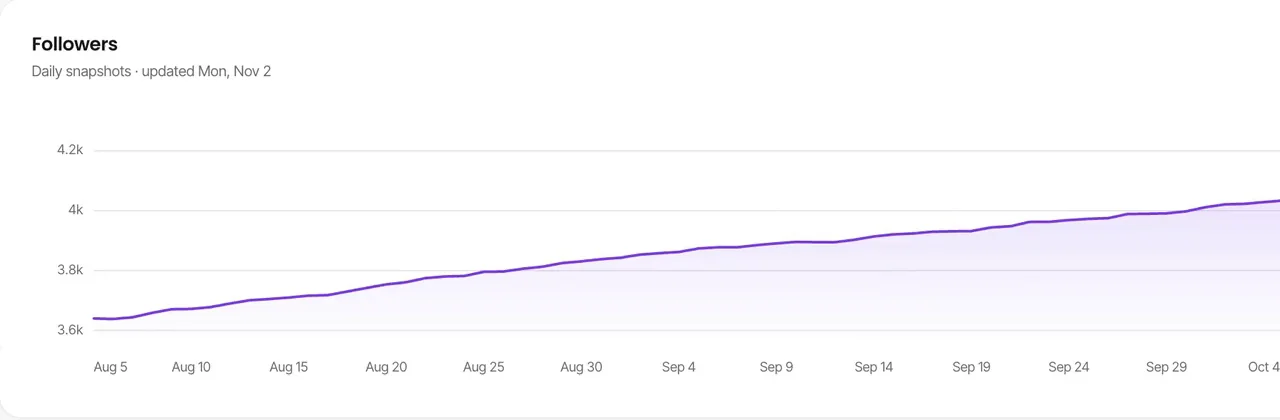
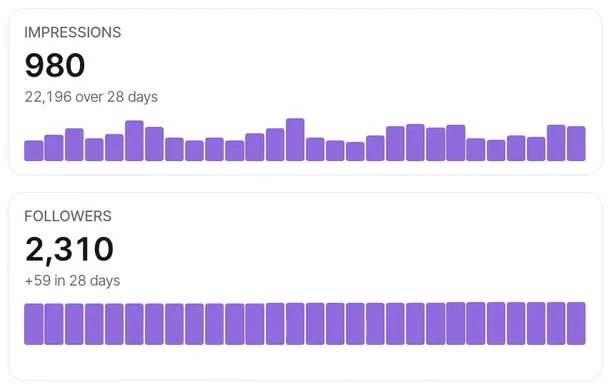
In a fictional Morrow Cafe workspace, Tess Morrow opens Analytics. The Facebook Page insights card is titled Morrow Cafe, so its 28 days of reach, impressions, engagements, and follows are labeled with the Page they belong to. Pinterest and YouTube show account numbers from daily snapshots, each with its movement over 7, 30, and 90 days: Pinterest followers went from 890 to 960 and YouTube subscribers from 1,144 to 1,240 over 90 days. On the Followers chart, Instagram grew from 3,640 to 4,210 followers over 90 days, up 187 (4.6%) in the last 30. The crosshair reads out a single day, the Facebook switch shows the Page’s own followers, from 2,080 to 2,310, and Daily change shows Instagram’s net change per day. Average reach by channel compares Instagram (1,525 per post across 10 posts) with Facebook (1,051 across 8), and the top post by engagement is the Instagram post “Friday, a little later. The reading corner stays open until 9 tonight.” with 2,412 reach and 415 engagements, 312 of them likes. Best times to post on Instagram suggests 07:30, 12:00, 17:30, and 19:30, based on 10 of her published posts blended with platform patterns, and Apply to my schedule replaces Instagram’s 09:00 and 17:00 posting times with those four. In Benchmarks, her Instagram account, @morrowcafe, sits in the You row with 4,210 followers and 231 average likes, next to three creators she tracks: Harbor Lane Bakes (11,620 followers), Pell Street Roasters (7,040), and Fig & Fern Kitchen (2,486). Krevaya Radar, included from the Plus plan, flags two of their posts at 3.3× and 4.1× their usual engagement, and their top posts open in a preview. In Posts, the published Instagram post “New on the bar: citrus espresso tonic, cold and bright.” shows its own numbers: 2,474 views, 1,871 reach, and 242 likes, with views rising from 421 an hour after posting to 2,474 at seven days. Every name and number is fictional, and applying the best times is the only change made.
Insights come back from Meta automatically and attach to the posts that earned them, so you can look up what worked.
Track the creators you admire and see their engagement next to yours, with the formats and topics that work for them.
Your results feed best-time scheduling and idea scoring, so the suggestions improve as your history grows.
Step-by-step articles from The Krevaya Fieldnotes.
Guide
Find posting times for your audience using a practical experiment, comparable metrics, timezone checks, and a free tracker. Includes a worked data example.
In Krevaya Analytics
Spot breakout posts from the creators and brands you track.
Create your account, choose a plan, and start making.
Try a plan for 7 days. Card required.